
Google Ads cost per lead by quarter: what a managed account looks like
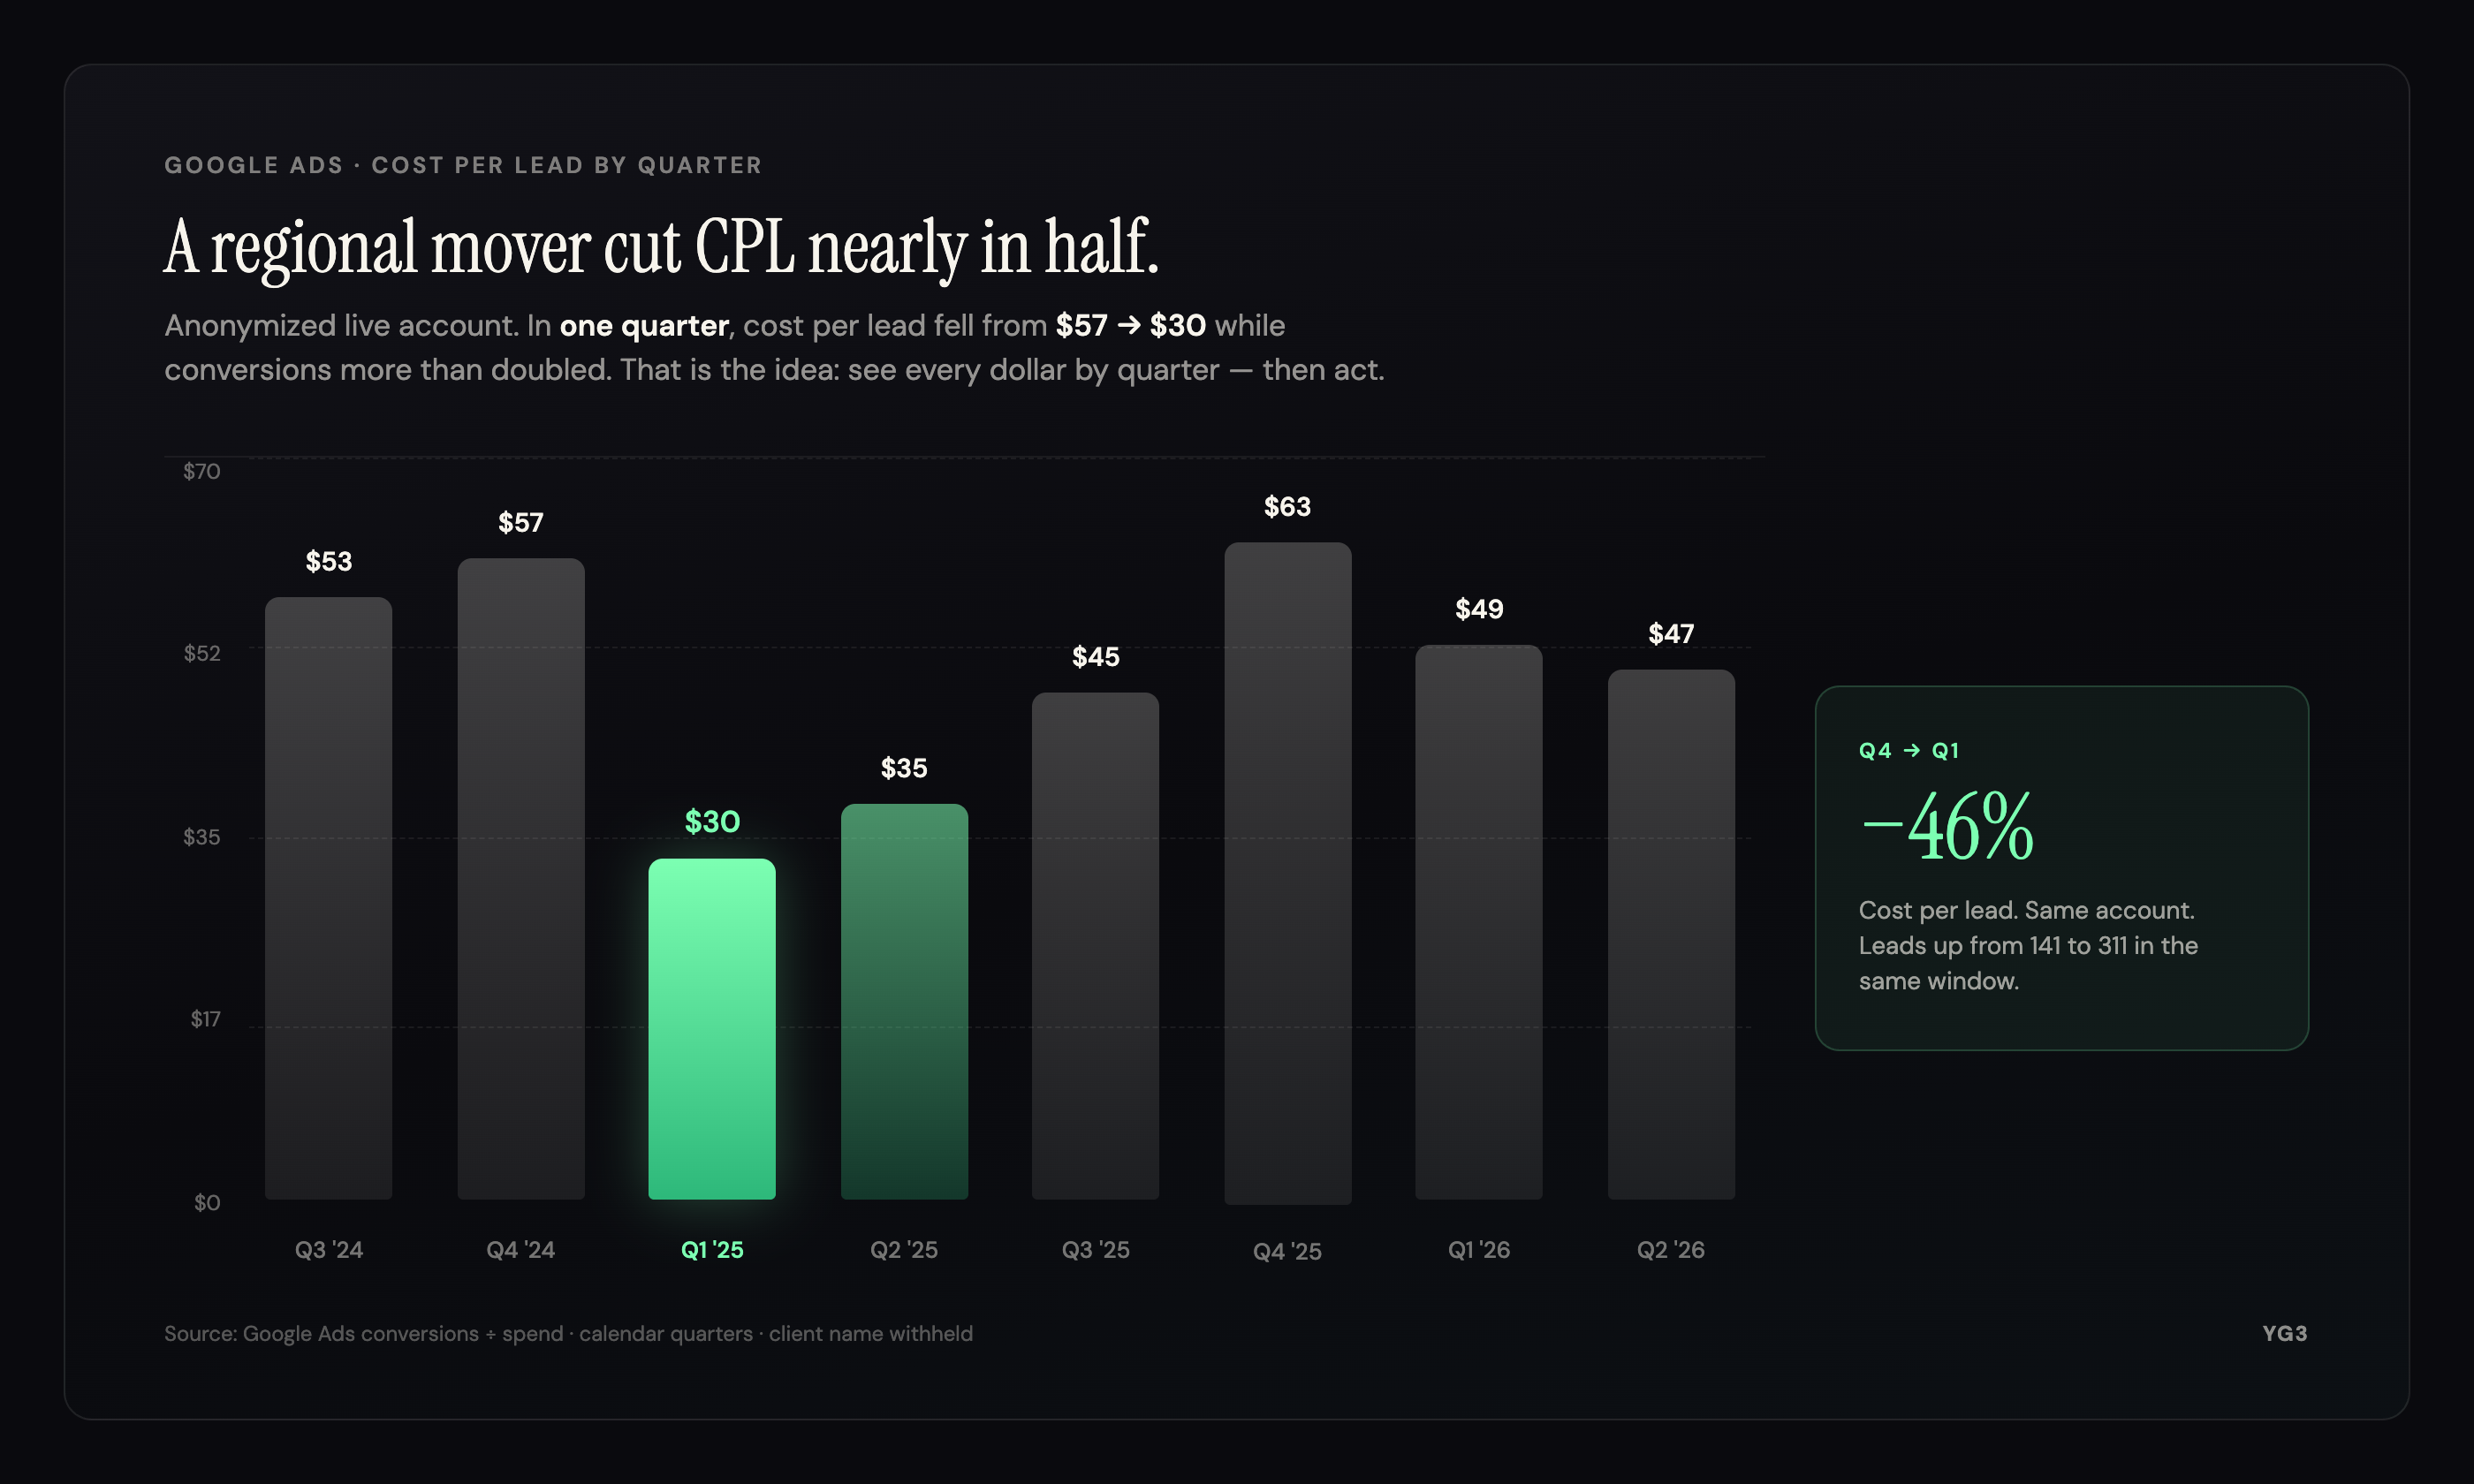
An anonymized regional mover cut Google Ads CPL from $57 to $30 in one quarter while leads more than doubled. Here is the chart, the method, and what it means.
Most Google Ads reports bury the story in daily noise. Quarters tell the truth.
We pulled calendar-quarter cost per lead from a live regional moving account (name withheld). In one quarter, CPL fell from $57 to $30 — −46% — while conversions rose from 141 to 311.

The idea
Paid ads only feel opaque when you cannot see efficiency over a long enough window. Weekly CPL jumps around. Quarterly CPL shows whether the account is getting cheaper to win — or more expensive to keep alive.
That is what YG3 Ads is built around: clarity on every dollar, recommendations you approve, and a view that makes the trend impossible to miss.
The numbers
| Quarter | Spend | Conversions | CPL |
|---|---|---|---|
| Q3 2024 | $11.5k | 218 | $53 |
| Q4 2024 | $8.0k | 141 | $57 |
| Q1 2025 | $9.5k | 311 | $30 |
| Q2 2025 | $14.4k | 418 | $35 |
| Q3 2025 | $12.9k | 289 | $45 |
| Q4 2025 | $14.0k | 222 | $63 |
| Q1 2026 | $13.5k | 276 | $49 |
| Q2 2026 | $17.3k | 364 | $47 |
Source: Google Ads account-level spend and conversions, grouped into calendar quarters. Client name withheld. Figures rounded for the chart.
What changed in one quarter
From Q4 2024 to Q1 2025 the account did not “spend its way” to more leads. Spend rose modestly. Conversions more than doubled. Cost per lead nearly halved.
That is the shape you want from managed search: more booked demand per dollar, not a prettier dashboard.
Why quarters, not days
- Noise drops. A bad week does not rewrite the story.
- Seasonality shows. Movers, HVAC, legal — demand moves with the calendar. Quarters respect that.
- Decisions stick. Bid, keyword, and creative changes need room to prove themselves.
YG3 still watches the account weekly. The quarterly CPL view is how owners see whether the work is compounding.
What this does not prove
One anonymized account is not a guarantee for every industry or budget. Auction prices move. Competition moves. Conversion tracking has to be honest.
What it does prove is narrower and more useful: when spend and conversions are visible by quarter, you can tell whether ads are getting cheaper to win. That is the standard we manage to.
How to run the same check on your account
- In Google Ads, set the date range to a full calendar quarter.
- Take cost ÷ conversions (the conversions you actually care about — calls, forms, booked jobs).
- Repeat for the prior quarter. Then the one before that.
- Plot CPL. If it is climbing while volume is flat, the account needs pruning — not more spend.
Or connect the account in YG3 and let the product surface the trend with recommendations you approve.
Clarity on every dollar starts with a window long enough to matter. See the product on YG3 Paid ads, or start free and connect Google Ads.


